


Force Amplitude and Phase Imaging of Sample Elasticity
Force Modulation Microscopy (FMM) with Park AFM is an extension of AFM imaging that operates in Contact mode and is used to detect variations in the mechanical properties of the sample surface such as elasticity, adhesion, and friction.
In FMM mode, the AFM tip is scanned in contact with the sample surface and the Z-feedback loop maintains a constant cantilever deflection as in constant-force mode AFM. In addition, a periodic signal known as the 'driving signal' is applied to the bimorph piezo and vibrates either the tip or the sample. The resulting tip motion is converted to an electrical signal. This electrical signal is separated into AC and DC components for analysis.
The DC signal represents tip deflection as in Contact AFM. The Z-feedback loop uses this signal to maintain a constant force between the tip and the sample to generate a topographic image. The AC signal contains the tip response due to oscillation. The amplitude of the AC signal, called 'FMM Amplitude', is sensitive to the elastic properties of the sample surface. A hard surface will deflect the oscillation, resulting in a large amplitude response. On the other hand, a soft surface will absorb the oscillation, resulting in a small amplitude response. The FMM image, which is a measure of the sample's elastic properties, is generated from variations in the FMM amplitude. An example of the amplitude response using FMM is shown in Figure 1.
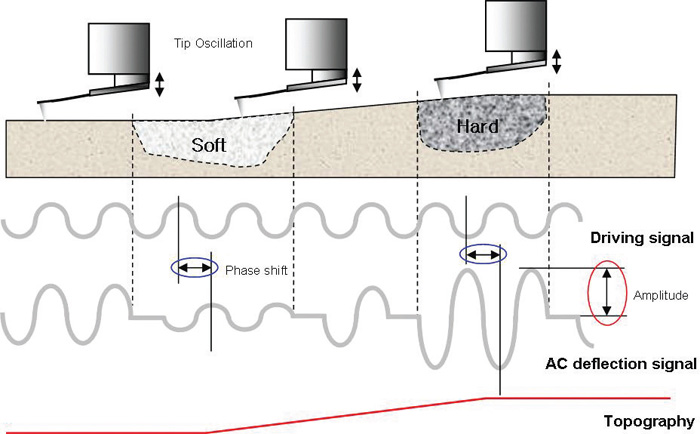
Figure 1. The amplitude of cantilever deflection varies according to the mechanical properties of the sample surface.
The phase shift of the AC signal, called 'FMM Phase', also differs according to the elastic properties of the sample surface. Hence, FMM Phase can be used to generate an FMM image. This technique is called Phase Detection Microscopy (PDM). Often, FMM Phase is more sensitive to the elastic properties of the surface than FMM Amplitude. PDM provides an additional contrast mechanism within a region of homogeneous hardness. Figure 1 shows a schematic diagram of the PDM principle.
The FMM generates a force modulation image, which is a map of the sample's elastic properties, from the changes in the amplitude of cantilever modulation. The frequency of the applied signal is in the order of hundreds of kHz, which is faster than what the Z-feedback loop is set up to track. Thus, topographic information can be separated from local variations in the sample's elastic properties and the two types of images can be collected simultaneously as shown in Figure 1.
In Park AFM, the key aspects of both Contact and True Non-Contact™ mode are combined to generate FMM imaging. The feedback parameters of the Contact mode of Park AFM are used to modulate the contact force between the tip and the sample while the frequency sweep, drive frequency, and drive gain of the True Non-Contact™ mode are used to control the tip or sample vibration, subsequently affecting the contrast of an FMM image.
Figure 2 shows the topography and FMM image of glass fiber-PP (poly-propylene) composite. One can observe the difference of stiffness between the glass and the PP regions. In Figure 3, the topography and FMM image of a bland polymer (SIBS 1027 60%+SMA 14 40%) are shown. In topography alone, the different components (SIBS and SMA) of the sample cannot be distinguished. However, the regions of SIBS and SMA having different stiffness property are clearly manifested in the FMM image.
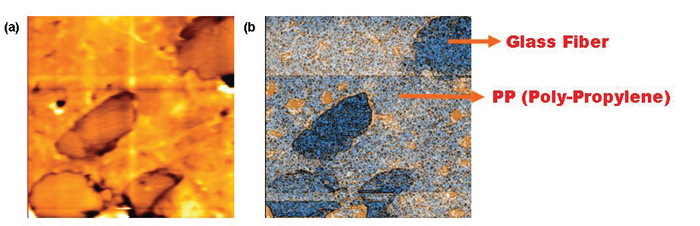
Figure 2. (a) Topography and (b) FMM image of glass fiber-PP composite (30 μm scan size).
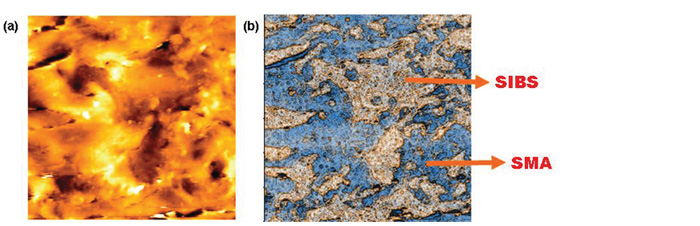
Figure 3. (a) Topography and (b) FMM image of blend polymer : SIBS 1027 60% +SMA 14 40% (30 μm scan size).