


Brian Choi, Bio-application scientist
For more information, please contact 该Email地址已收到反垃圾邮件插件保护。要显示它您需要在浏览器中启用JavaScript。
Reference: Philippe Pittet, et al. (2008),
Fibrogenic fibroblasts increase intercellular adhesion strength by reinforcing individual OB-cadherin bonds,
Journal of Cell Science 121, 877-886 (2008)
Cell adhesion molecules play important roles in cell-to-cell communication where cells work together to perform vital physiology processes. Cadherin is one typical protein that acts as cell adhesion molecules, forming adherens junctions to bind cells within tissues together. Force-distance spectroscopy, operating in atomic force microscopy (AFM), is useful to analyze the adhesion molecule interaction quantitatively at the single/multiple molecule level in nanonewton scale.
- Study the cell communication processes at fundamental level by measuring the adhesion force with force distance spectroscopy of AFM
- Cell grown tipless cantilever enables researchers to accurately acquire a large amount of cadherin adhesion force curves
- Cadherin bonds can be identified in the membrane of live myofibroblast
Cell Grown Tipless Triangular Cantilever
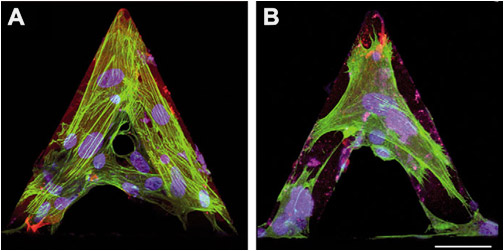
Differentiated myofibroblasts were grown on tipless AFM cantilevers in control conditions (A) or treated for 30 minutes with 1 μM cytochalasin D to depolymerize F-actin (B). Cells were immunostained for α-SMA (green) and nuclei (blue) then images were taken with a confocal microscope.
Cadherin bonds’ adhesion force detection experiment with aFM
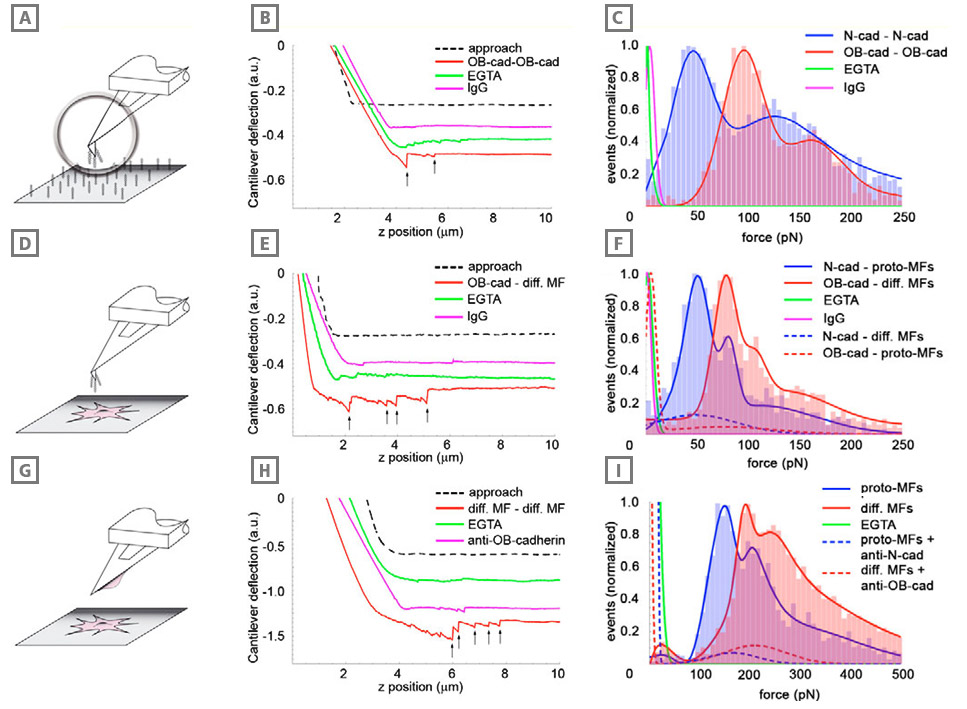
Adhesion of differentiated myofibroblasts is stronger than that of the proto-myofibroblasts. Adhesion forces were measured with AFM between cadherin dimer-coated cantilevers and similarly coated substrates (A-C), between cadherin dimer-coated cantilevers and myofibroblasts (D-F), and between myofibroblasts grown on cantilevers and myofibroblasts grown in monolayers (G-I). In all conditions, cantilever approach-retraction velocities were set to 0.1 μm/second, loading force to 3 nN and contact time to 2 seconds. Typical force-distance curves (B,E,H) under different conditions are displayed for each configuration; arrows indicate positions where bond rupture occurs in a ‘jump’. Red profiles indicate the typical interaction between OB-cadherins (osteoblast) or the differentiated myofibroblasts in the different set-ups, green lines represent the controls in the absence of extracellular Ca2+ (EGTA) and pink lines show the controls performed with Immunoglobulin (IgG)-coated cantilevers (B,E) or contacts formed in the presence of OB-cadherin-blocking peptides (H). Rupture forces (C,F,I) displayed as histograms (n ≥5000 in each condition) were normalized for the total number of rupture events in every configuration and were fitted with Gaussian curves. Results obtained with proto-myofibroblasts and Ncadherin (neural) are displayed in blue, whereas the results for differentiated myofibroblasts and OB-cadherin rupture forces are indicated in red. Note the different scale in H that allowed the significantly higher bond strength in the cell-cell set-up compared with the set-ups in B and E. Cadherin specificity of interactions was controlled by coating the cantilevers with human IgG (C,F, pink), by using EGTA (green) and by applying anticadherin peptides (I, dashed lines).
Park Cell Analysis Systems
|
|
|
|
| Park NX12-Bio | Park NX10 | Park XE7 | |
| Scanning Ion Conductance Microscopy (SICM) | |||
| Atomic Force Microscopy (AFM) with liquid probe hand | |||
| Inverted Optical Microscopy (IOM) | |||
| Live Cell Chamber |