


Enabling Innovation in Photosensitive Materials Research
Building upon the strength of its state-of-the-art conductive AFM options, Park Systems has developed the ground-breaking capability of Time-Resolved Photocurrent Mapping (PCM). The mapping mode measures the temporal response of photosensitive materials to time-resolved illumination without any interference from unwanted light source including an AFM's feedback laser.
- Time-domain spectroscopy of photocurrent excitation by monitoring the response to time resolved light illumination
- Performing automated spectroscopic analysis of the lifetime and point-by-point mapping of the local photoelectric response
 |
 |
|
Figure 1 (a). A typical photocurrent response to a time-resolved illumination. The current between the sample and a voltage-biased cantilever is measured before, during, and after the illumination. |
Figure 1 (b). Point-by-point mapping of photocurrent spectroscopy. Photocurrent response in time domain is acquired in each grid point defined on a sample. |
Advanced Conductive-AFM and I/V Spectroscopy
AFM enables measurement of various local properties of samples in nanoscale; one of its greatest uses is its ability to measure local conductivity; data is acquired by placing a biased cantilever onto a sample surface. The current between the two can be as low as a few pA which requires sub-pA current noise reduction. Park Systems offers the state-of-the-art conductive AFM options, which can detect current signals from mA to sub-pA. With remarkably low-noise performance, the minute changes in sub-pA currents are detected in the I/V curves of VLSI contact plugs (see Figure 2).
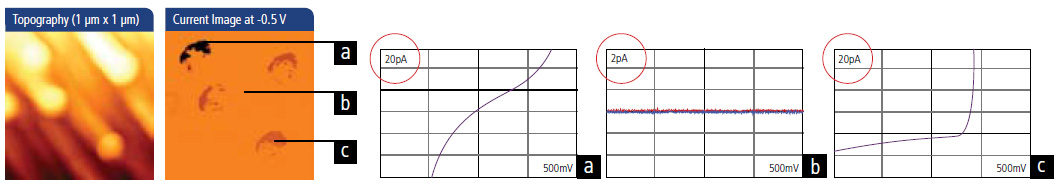
Figure 2. Topography, Current Image and IV Curves of VLSI Contact
PCM measurement sequence
With all light sources turned off, including the AFM's feedback laser, a reset voltage is applied to clear residual charges in photosensitive samples [A]. After applying the bias voltage [B], a photoelectric current is measured during time-resolved illumination [C], which is followed by the measurement of the photocurrent decay after the illumination is switched off [D].
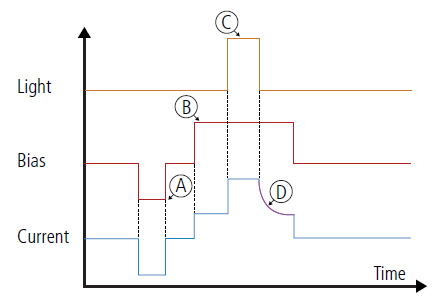
Figure 3. The measurement sequence of Time-resolved Photocurrent Mapping
Simultaneous Acquisition of Topography and Time-resolved Photocurrent
Combined with high-speed and low-noise acquisition of electric currents, PCM enables the point-by-point mapping of excitation lifetimes, hence resolving the spatial variation of photoelectric properties within a photosensitive sample.
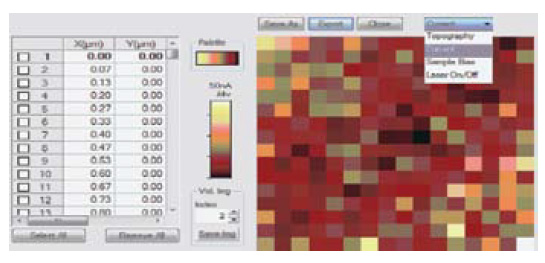
Figure 4. Photocurrent responses on different sample points are being measured by the PCM.
Dedicated and Automated Analysis of Photocurrent Spectroscopy
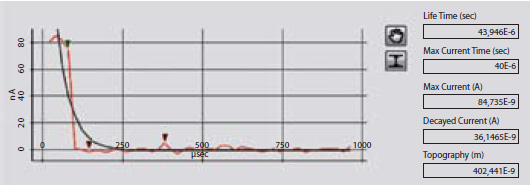 Figure 5. From the photocurrent spectroscopy data, the life time of the photocurrent excitation is analyzed automatically.
The dedicated user interface allows the automated analysis and calculation of the excitation lifetime. In Figure 5, the change of photocurrent on a given sample point is plotted with the lifetime of photocurrent excitation displayed on the right side.