


Force Measurement of Tip-Sample Interaction
Force vs. Distance Spectroscopy
In Force-Distance Spectroscopy, force vs. distance (F vs. d) curves are used to measure the vertical force that the tip applies to the surface while a contact-AFM image is being taken. This technique can also be used to analyze surface contaminants’ viscosity, lubrication thickness, and local variations in the elastic properties of the surface.
Strictly speaking, a force vs. distance curve is a plot of the deflection of the cantilever versus the extension of the piezoelectric scanner, measured using a position-sensitive photodetector. The van der Waals force represents just one contribution to the cantilever deflection. Local variations in the form of the F vs. d curve indicate variations in the local elastic properties. Contaminants and lubricants affect the measurement, as does the thin layer of water that is often present when operating an AFM in air.
In the laboratory, force vs. distance curves are quite complex and specific to the given system under study. The discussion here refers to Figure 1 and represents a gross simplification, where shapes, sizes, and distances should not be taken literally. With this in mind, consider the simplest case of AFM in vacuum as shown in Figure 1 (a). At the left side of the curve, the scanner is fully retracted and the cantilever is undeflected since the tip is not touching the sample. As the scanner extends, the cantilever remains undeflected until it comes close enough to the sample surface for the tip to experience the attractive van der Waals force. The tip snaps into surface at point a of Figure 1(a). Equivalently, the cantilever suddenly bends slightly towards the surface.
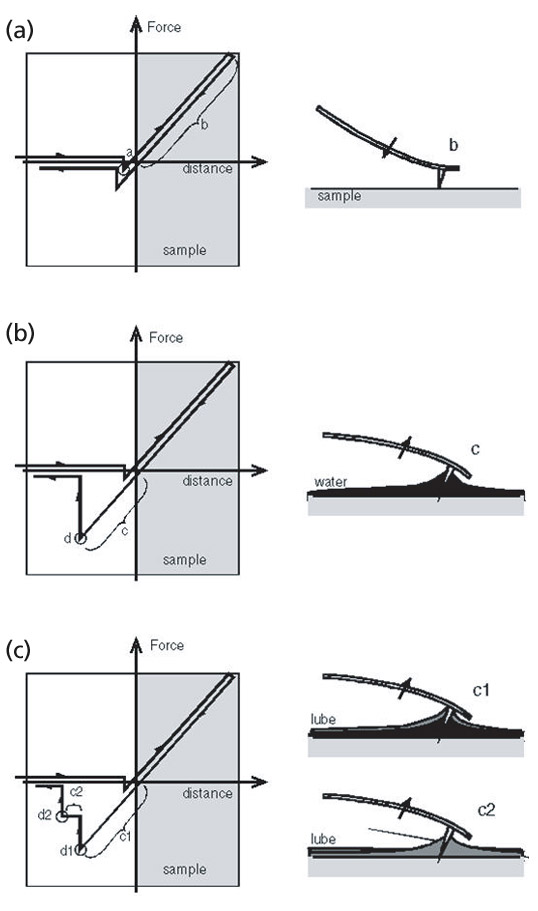
Figure 1. (a) Force vs. distance curves in vacuum, (b) air, and (c) air with a contamination layer.
As the scanner continues to extend, the cantilever deflects away from the surface, approximately linearly in region b of Figure 1. After full extension, at the extreme right of the plot, the scanner begins to retract. The cantilever deflection retraces the same curve as the scanner pulls the tip away from the surface.
In air, the retracting curve is often different because a monolayer or a few monolayers of water are present on many surfaces as shown in Figure 1 (b). This water layer exerts a capillary force that is very strong and attractive. As the scanner pulls away from the surface, the water holds the tip in contact with the surface, bending the cantilever strongly towards the surface in region c of Figure 1(b) . At some point, depending upon the thickness of the water layer, the scanner retracts enough that the tip springs free at point d of Figure 1. This is known as the snap-back point. As the scanner continues to retract beyond the snap-back point, the cantilever remains undeflected as the scanner moves it away from the surface in free space. If a lubrication layer is present along with the water layer, multiple snap-back points can occur, as shown in Figure 1(c). The positions and amplitudes of the snap-back points depend upon the viscosity and thickness of the layers present on the surface.
Contact AFM can be operated anywhere along the linear portion of the force vs. distance curves, in regions b or c of Figure 1. Operation in region c might be used for soft samples, to minimize the total force between the tip and the sample. Operating with the cantilever bent towards the surface is inherently a less stable situation, and maximum scan speeds may have to be sacrificed. Note that operation in region c is still called contact mode, since the tip is touching the sample. Non-Contact AFM is operated just to the left of point a on the F vs. d curve. just before the tip snaps into the surface due to the attractive van der Waals force.
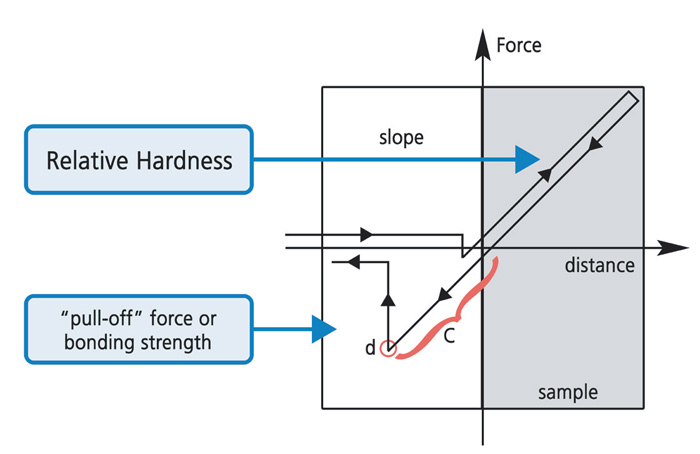
Figure 2. The various elastic properties that can be measured from Force vs. Distance curves.
In the linear region of the F vs. d curves, the slope is related to the elastic modulus of the system. When the cantilever is much softer than the sample surface, as is the case for non-destructive imaging, the slope of the curve mostly reflects the spring constant of the cantilever. However, when the cantilever is much stiffer than the sample surface, the slope of the F vs. d curve allows investigation of the elastic properties of the sample as shown in Figure 2.