磁力显微镜 (MFM)
磁性质的高分辨率和高灵敏度成像
我们的MFM模式通过检测磁化悬臂和样品表面之间的相互作用来测量样品表面的磁变化。悬臂在第一次扫描时测量表面形貌,然后抬起并跟随存储的表面形貌(仅在选定国家可用的提升模式)或在样品表面上方固定高度处以恒定距离(或恒定高度)移动。
x
我们的MFM模式通过检测磁化悬臂和样品表面之间的相互作用来测量样品表面的磁变化。悬臂在第一次扫描时测量表面形貌,然后抬起并跟随存储的表面形貌(仅在选定国家可用的提升模式)或在样品表面上方固定高度处以恒定距离(或恒定高度)移动。
磁力显微镜(MFM)是一种原子力显微镜(AFM)应用,广泛用于表征各种材料在纳米尺度上的磁性特性。在这种技术中,涂有铁磁材料的尖锐针尖扫描表面并绘制样品上磁畴的分布和强度图。MFM模式可用于探测磁性材料的属性,以进行学术和应用研究,例如表征、评估和开发磁性存储设备和磁性记录组件,如硬盘介质和磁阻头,以及成像磁性材料中自然发生或故意写入的磁畴结构。
MMFM模式使用非接触模式来检测样品的表面形貌。同时,通过测量悬臂振荡的振幅和相位来生成MFM图像。这些信号包含有关样品表面磁畴分布的信息。MFM可用于成像磁性材料中自然发生或故意写入的磁畴结构。

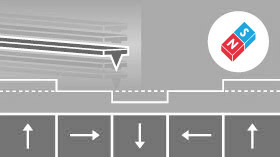
图1. 用于MFM的“双程”技术(提升模式)示意图,应用于包含多个不同磁化区域的示例样品结构。形貌信号(①)在第一程扫描中靠近样品时获得,而MFM信号的振幅和相位(②)分别在第二程扫描中获得,它们分别捕获磁化的相对强度和方向。.
在MFM测量中,探针和样品之间存在两种力:范德华力和磁力。范德华力(如排斥力和吸引力)在探针和样品之间距离较近时较强,而磁力在距离样品较远时较强。虽然范德华力与1/r6, 成正比,但磁力与1/r2 (r:探针针尖和样品表面之间两个原子之间的距离)。MFM模式利用这种力梯度的差异来分离这两种力的贡献。在探针-样品距离相对较小的区域,范德华力占主导地位,可以进行非接触成像以收集形貌信息。通过增加探针-样品距离,可以在磁力占主导的区域收集MFM信号。获得良好MFM结果的关键在于从整个信号中分离出磁信号。在MFM模式中,“双程”技术(称为“提升模式”)是获得清晰MFM结果的一个好选择。
在MFM模式中,如图1所示,样品被扫描两次以分离信号。在第一次扫描中,探针以非接触模式扫描样品表面,以获得样品表面的形貌,如图1(①)所示。在第二次扫描中,当探针-样品距离增加时,探针仅受磁力影响。控制磁化探针沿着从第一次扫描获得的形貌线移动。MFM图像作为结果获得,如图1(②)所示。
在形貌线中,探针保持在恒定的探针-样品距离,这等于恒定的范德华力。因此,当探针在第二程“MFM模式”扫描中跟随形貌线时,作用在探针上的范德华力保持不变。因此,影响信号的唯一力变化是磁力的变化。因此,可以从第二次扫描中获得不含形貌信号的MFM图像。
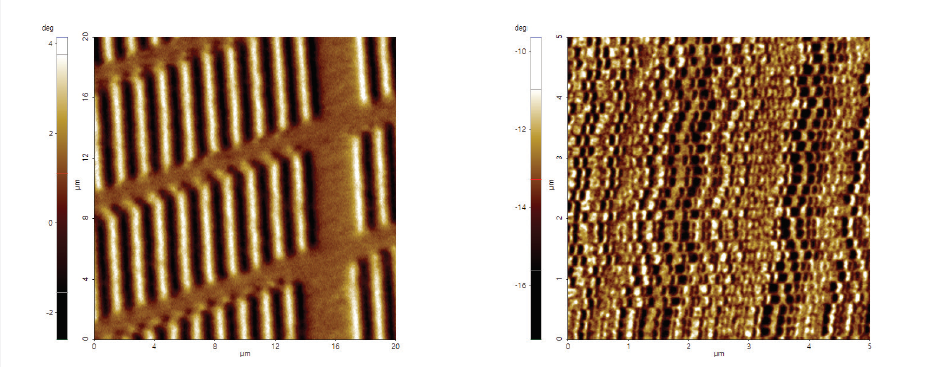
图2. 通过(a)纵向磁记录(LMR)和(b)垂直磁记录(PMR)记录的数据存储的磁畴图案的比较MFM测量。MFM相位图像展示了与LMR相比,PMR如何实现更高的磁畴密度。
如前所述,MFM模式在磁存储设备领域是一种广泛使用的技术。有几种磁记录方法:热辅助磁记录(HAMR)、纵向磁记录(LMR)、垂直磁记录(PMR)和叠瓦式磁记录(SMR)方法。所有这些技术都是为了允许硬盘驱动器以低成本增加数据密度而开发的。为了增加数据密度,必须在更小的空间中存储更多数据。因此,表征需要MFM模式提供的纳米级分辨率。图2显示了通过MFM模式成像的LMR和PMR实现的不同磁畴密度。在(a)中,通过LMR记录的设备的MFM相位在20微米x20微米的扫描范围内显示出相对较低的磁畴密度。另一方面,(b)中PMR样品的MFM相位在5微米x5微米的扫描区域内解析了高磁畴密度。因此,MFM测量清楚地表明,PMR实现了比LMR高得多的存储密度。
T为了在硬盘介质上存储数据,需要根据每个应用定制磁畴图案。图3显示了MFM相位图像,这些图像解析了写在硬盘介质表面不同位置的不同磁畴图案。位置1和2以20微米x20微米的扫描尺寸测量,在MFM相位中显示出较低的磁畴密度。其余7个位置以5微米x5微米的扫描尺寸测量,并显示出增加的磁畴密度。我们发现磁畴图案有各种不同的排列方式。位置5、6和9的MFM相位图像显示出像素化图案,而位置8则显示出周期性条纹磁畴。相比之下,位置4和7显示出无序的磁畴图案。因此,这些MFM测量突出了同一样品上磁畴排列和密度的各种可能性。
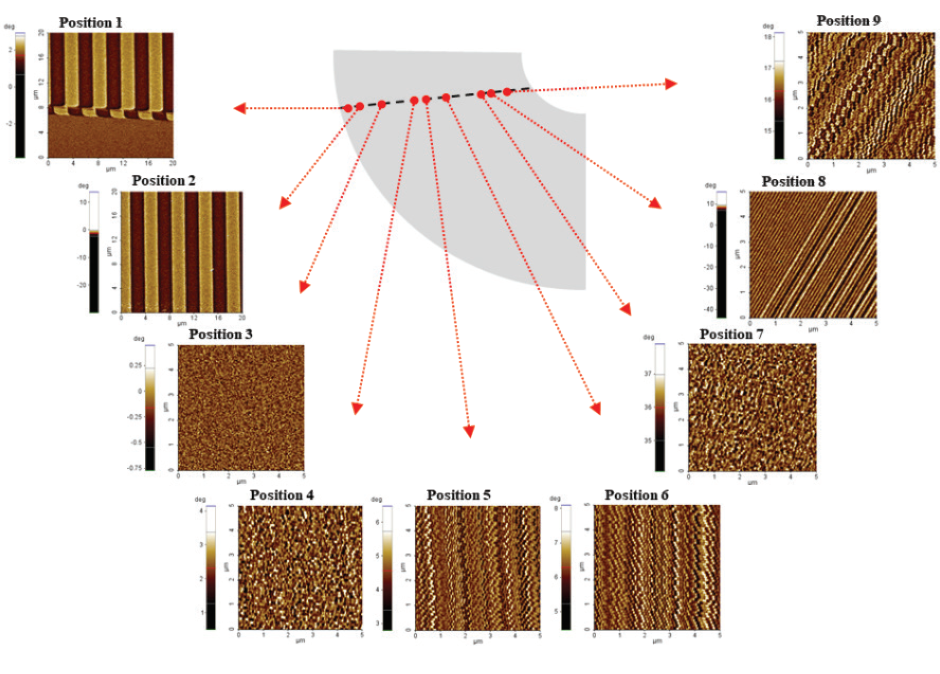
图3. 硬盘表面上的MFM相位图像,展示了各种不同的磁畴结构和密度。位置1和2的成像扫描尺寸为20微米x20微米,其余位置的扫描尺寸为5微米x5微米。
图4展示了铁素体-奥氏体双相不锈钢的MFM测量,这种不锈钢具有由铁素体和奥氏体平衡比例组成的两相微观结构。与基于纯铁素体或奥氏体相的不锈钢相比,铁素体-奥氏体双相不锈钢具有优良的性能。双相不锈钢具有比奥氏体不锈钢更高的强度,比铁素体不锈钢更高的冲击值,对一般腐蚀的抵抗力更强,并且比奥氏体不锈钢具有更好的导热性。50:50的铁素体:奥氏体比例是双相钢微观结构的理想选择。铁素体和奥氏体相等比例导致最优的机械和腐蚀性能。如图4所示,MFM相位图像可用于研究铁素体和奥氏体的比例。虽然(a)中的AFM形貌仅显示微弱的对比度,(b)中的MFM相位则在双相钢表面显示出明显的材料对比度。因此,奥氏体相在相位图像中可识别为明亮且均匀的对比度,而铁素体相则呈现出其典型的图案化MFM对比度。
除了标准的MFM成像外,Park AFM还提供了通过磁场发生器(MFG)作为可选功能来施加外部磁场以改变样品磁态的可能性。图5总结了使用MFG改变钇铁石榴石(YIG)表面磁畴分布的MFM测量,通过施加从0高斯到270高斯的外部面内磁场。虽然(a)中的样品形貌保持不变,(b)到(d)中的MFM相位图像捕捉到了不同外部面内磁场强度下磁畴图案的变化。在这里,之前(b)中0高斯时的随机磁畴图案逐渐变得更加有序,直到在(d)中270高斯时磁畴排列成周期性条纹结构。
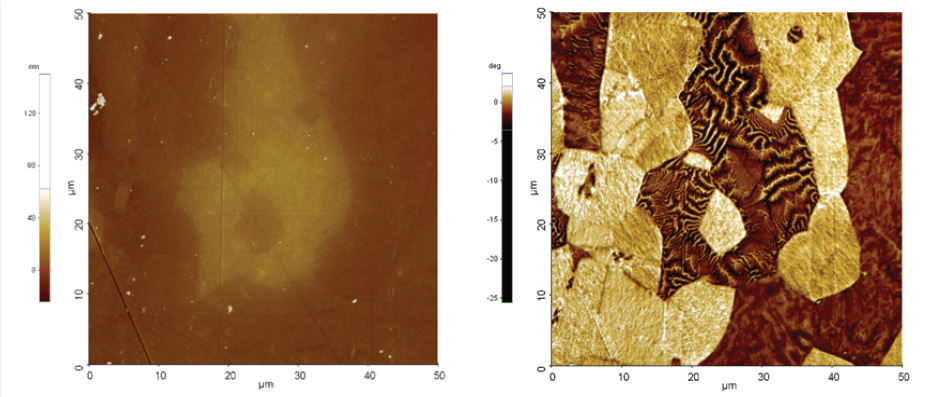
图4. 对铁素体-奥氏体双相不锈钢进行MFM测量,以表征两种材料的混合行为和分布。(a)具有微弱对比度的AFM高度图像和(b)在奥氏体相和铁素体相上具有明显材料对比度的MFM相位图像。扫描尺寸为50微米x50微米。
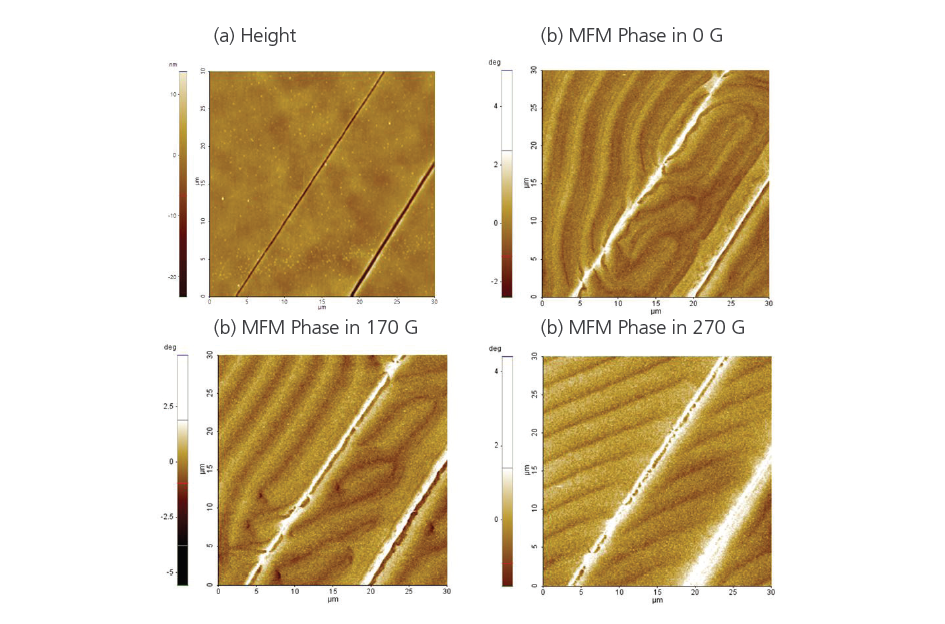
图5. 使用Park的磁场发生器施加不同强度的外部磁场时,对钇铁石榴石(YIG)样品表面进行的MFM测量。(a)仅具有微弱对比度的AFM高度图像,(b)无外部磁场时的MFM相位图像,(c)170高斯时的MFM相位图像和(d)270高斯时的MFM相位图像。